Infographics

I have used infographics as a short & sweet way to help students visualize their course week. Click on the image to enlarge it.

Choosing an IPP

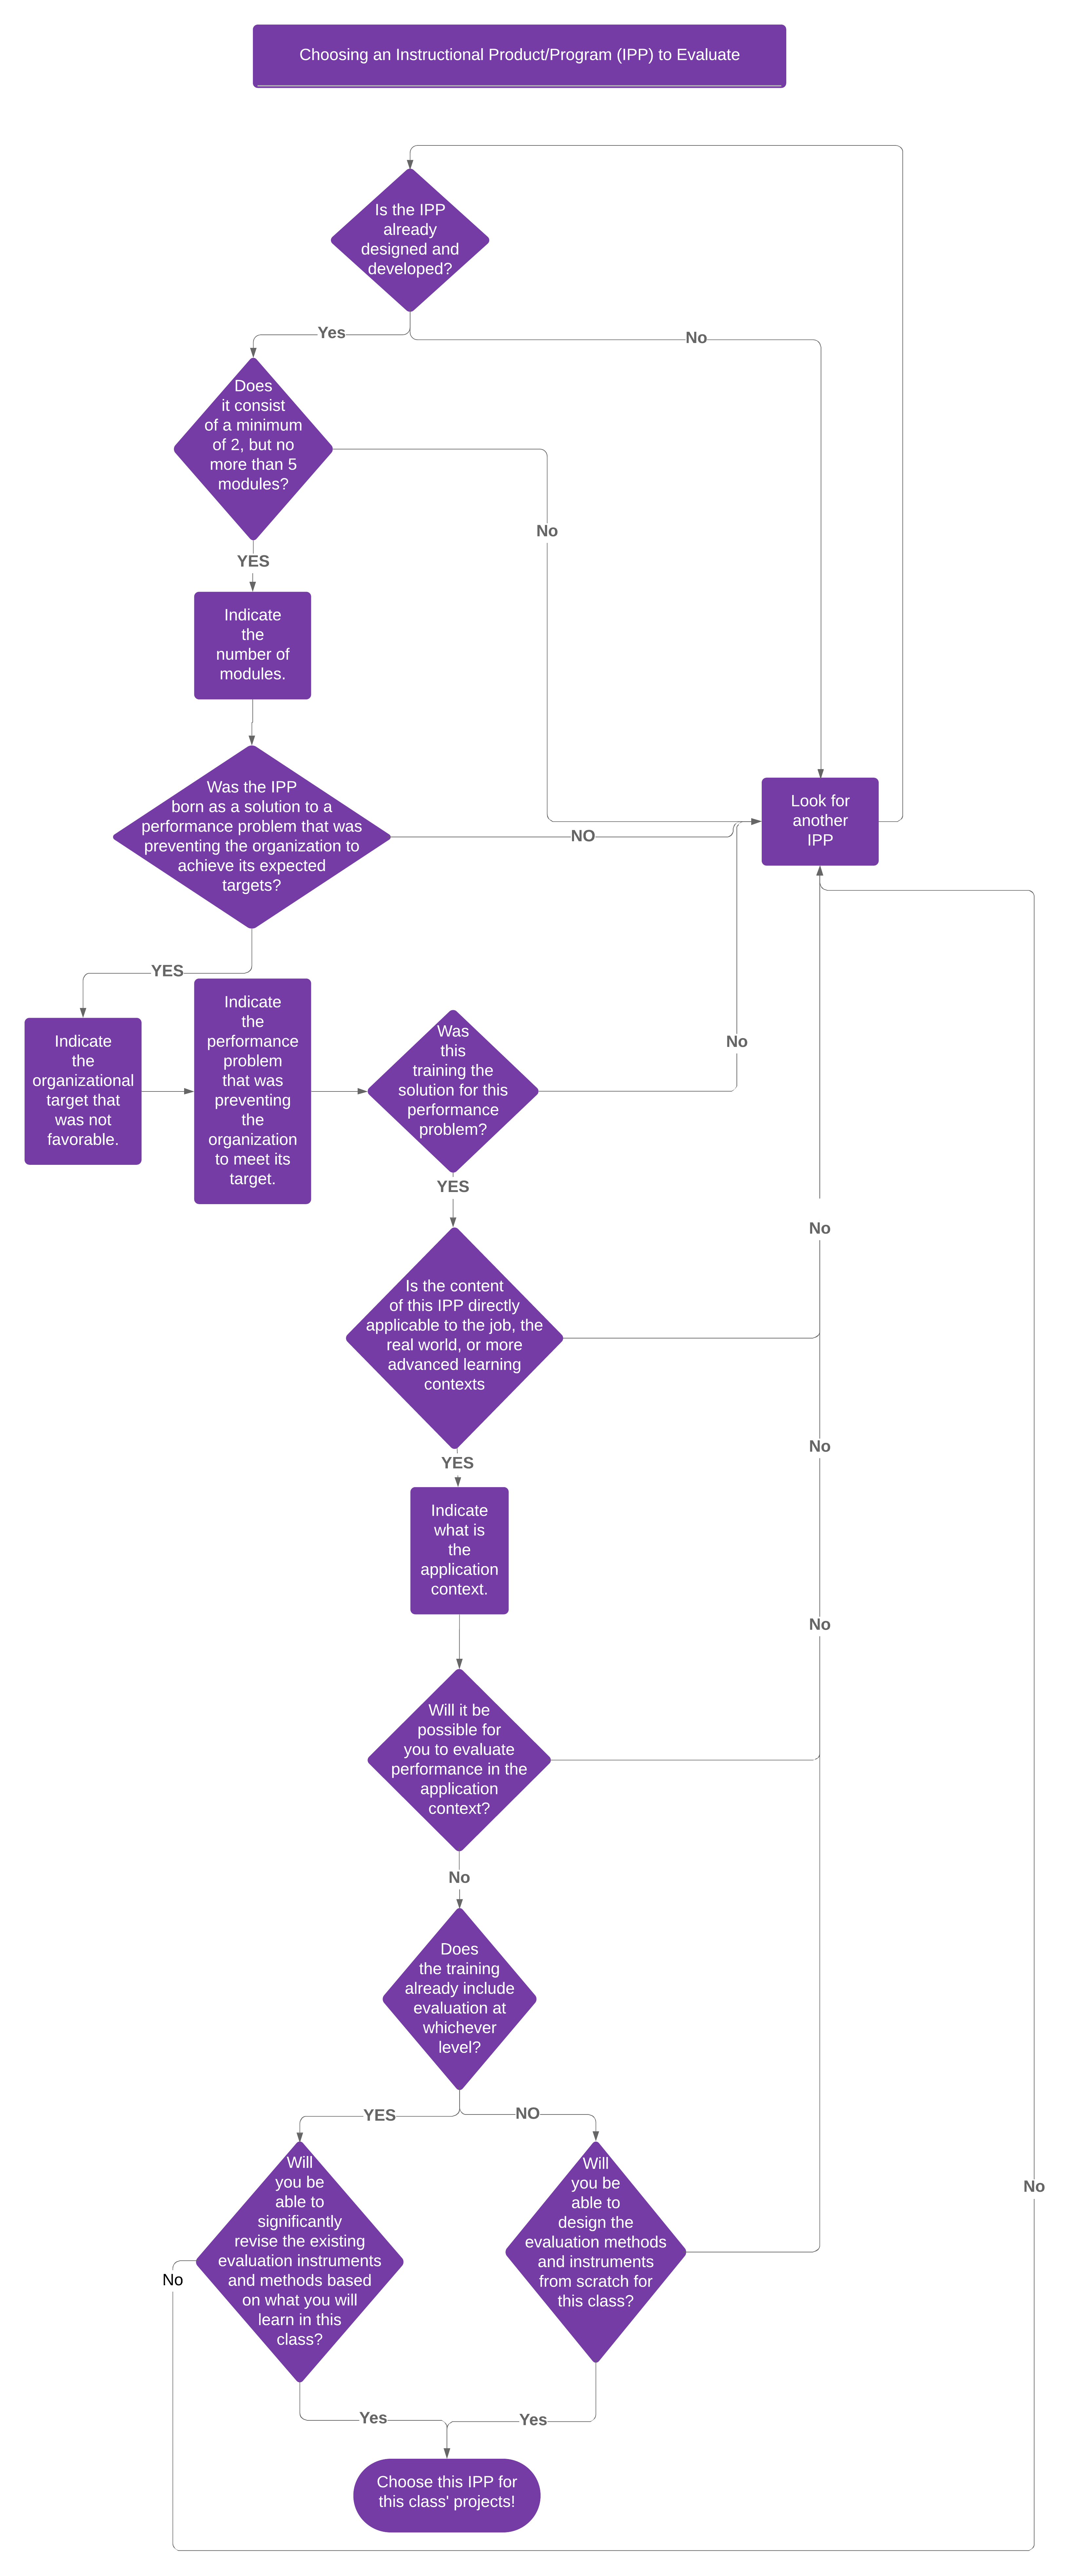
The course on Strategic Assessment & Evaluation requires that students write an evaluation report. They must choose an instructional program or product (IPP) that can be evaluated at all levels of the Kirkpatrick model. Students usually struggle to select an appropriate program and usually choose ones that can only be evaluated up to level 2. I created this flowchart to guide them to examine the program they have they mind to determine whether it is appropriate.

[View Large Size Version | PDF Version]
(Press CTRL + OR CMD + to enlarge it)

Week 4 Announcement

The Advanced Instructional Design course was unusual in that the class as a whole would have a timeline but individual groups had a separate timeline. The purpose of this infographic was to have a visual representation of the deadlines of each group and class.

Week 5.5 Announcement

I used this infographic to remind students of the weekly activities for the short week of Thanksgiving with recommendations to continue to work on an assignment and then to take a break.